Graphing and collecting sensor data via serial communication on STM32 MCU
When creating applications, it is often necessary to collect digital data such as sensor data captured by MCU while graphing it in real time like an oscilloscope. We introduce an easy-to-use data logger that can import data into Microsoft Excel while displaying the data on a PC monitor using serial communication.
Table of contents
What is a data logger application?

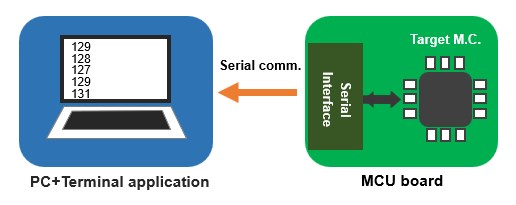
Until now, sensor data and other data captured by MCU via serial communication and other means have been output to a PC or other monitor for display using a terminal emulator. Although these data can be checked in real time, it is difficult to grasp how the data changes because it is a numerical display.
In particular, data that changes over time, such as the rotational speed and position of a moving motor, can be analyzed during development and performance can be checked and evaluated if not only numerical but also graphical displays can be used to visualize the changes.
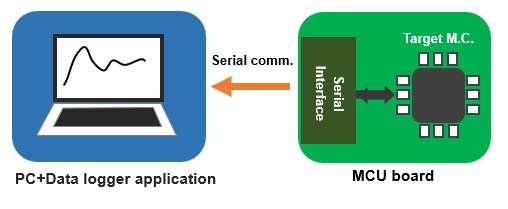
A device that monitors, displays, and records digital data measured and collected by capturing electrical signals from sensors and other sources is called a data logger, and a variety of manufacturers offer such devices as products. Here, as a simple data logger, we will use free software that can graphically display data transmitted via serial communication in real time and simultaneously save the data to a Microsoft Excel file (csv format).
I myself used to program and create my own specialized Windows applications using VB (Visual Basic), C#, etc. that displayed graphs of data received via serial communication, but it is troublesome to create a specialized application each time, and if a general-purpose application is available as free software for measurement purposes only, there is no choice but to use it.
Recommended Data Logger Free Apps.
I searched for a data logger application that is intuitive and easy to use, and recommend Data Techno's real-time graphing software CPLT (download destination homepage).
I am grateful for the free offer of this very simple and practical application that can be used immediately after the initial setup of communication and scaling of the vertical and horizontal axes.
Download the application CPLT Version xxx compressed file, unzip it, and double-click the executable file to launch the application.
Actual Application Utilization
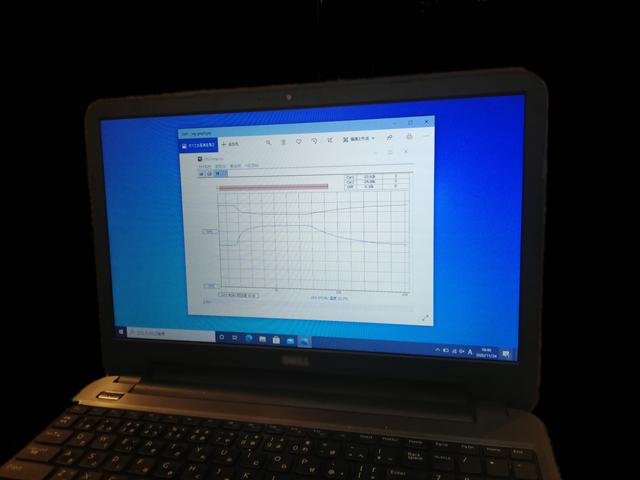
As an application to capture and monitor data from a sensor, I will use "Thermometer using STM32 Nucleo" to monitor temperature and thermistor resistance.
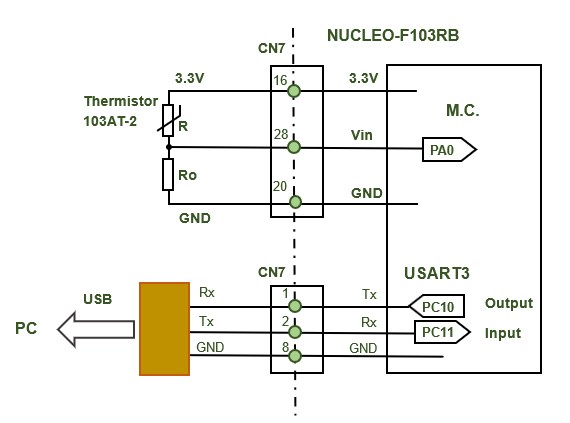
The circuit is shown in the figure above, and the COM port is set to the one recognized by USB in setting (S), and the communication condition is set to the one set in the program (9800, 8 bits, no parity, stop bit 1).
the first for thermistor resistance and the second for temperature. Specify the name, unit, and data value per tick (scale) for each channel attribute, respectively. On the horizontal axis, specify the number of data per scale. For example, if one plot is transmitted at 0.5s intervals and the number of data per tick is 10, one tick corresponds to 5s.
Programs for Data Loggers
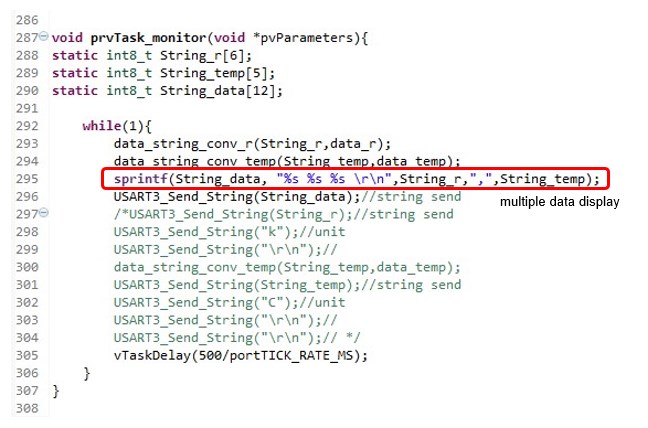
Only the serial transmission part of the thermometer application program (temp monitor.c) will be modified for data logger.
Note that when specifying multiple channels, multiple data should be sent in comma-separated chunks. Both numerical values and character strings seem to be discriminated by the application. When using the standard C language function spirntf, please include stdio.h.
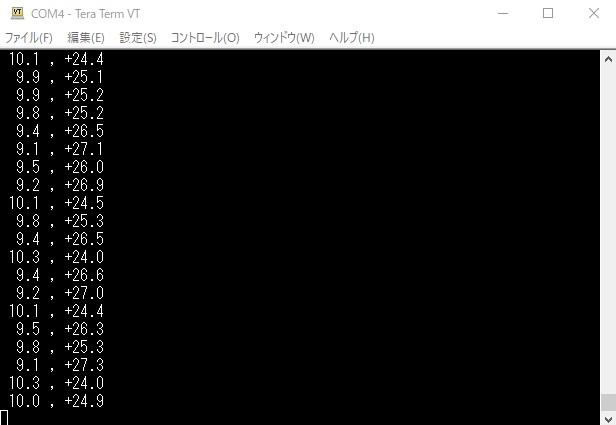
As before, first check the transmitted data in the terminal emulator. If the data is comma-separated as shown in the figure below, then the order of the data is CH1, CH2…. If the data are separated by commas as shown in the figure below, they will be recognized as CH1, CH2…. Now that everything is ready, let's start displaying real-time graphs with the data logger application.
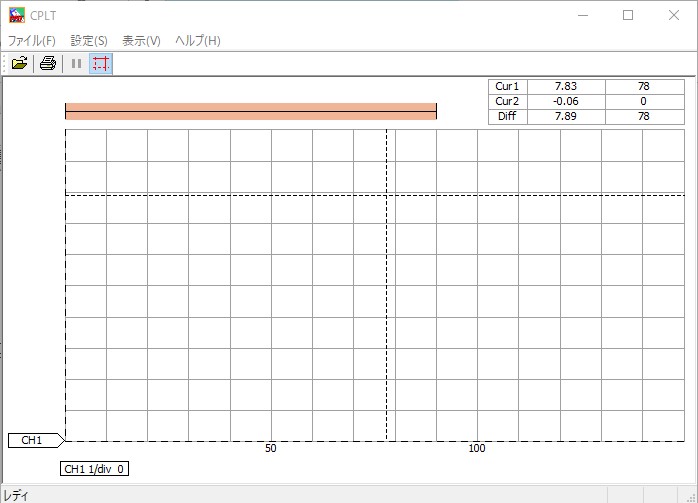
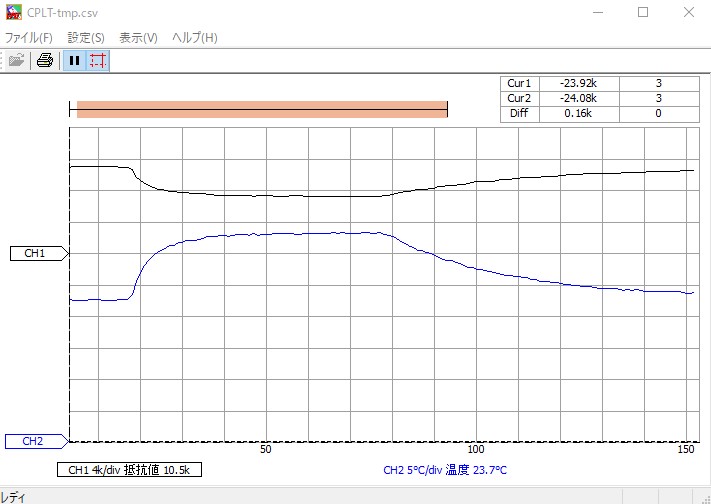
After starting the application CPLT, data monitoring starts by specifying the file name for data collection in "File" - "Logging". If there is no problem, the graph display of CH1 and CH2 data will begin.
The interval between data plots can be adjusted by setting the horizontal axis to a suitable one. The data displayed in the graph is simultaneously collected in an Excel file (csv format) for each channel, and can be used as data for analysis and evaluation.
When data loggers are available, actual data can be graphed in real time so that data changes can be analyzed. In particular, it is essential to verify actual operation in applications for motor speed and position control in motion control.
Even in hobby applications, a data logger can be used to evaluate the validity of operations, as if checking an electrical analog signal with an oscilloscope, and the processed digital values can be visualized on a monitor, and it will be a powerful tool for application development.